

Find the signal
inside your campaign data.
Start with a performance overview, then explore the campaigns, offers, sources, and audience dimensions behind the result. Keep cost, conversion revenue, profit, and ROI in the same reporting workspace.
Start with the Free plan. No credit card required.
- Up to 3 grouping levels
- Custom columns & filters
- CSV & reporting API
Connect with the tools in your workflow







The total tells you what happened. Detail tells you where.
Two campaigns can reach the same revenue with very different costs. A single source can perform differently by country, device, or placement. Skro lets you inspect those differences before making the next decision.
Start with the overview
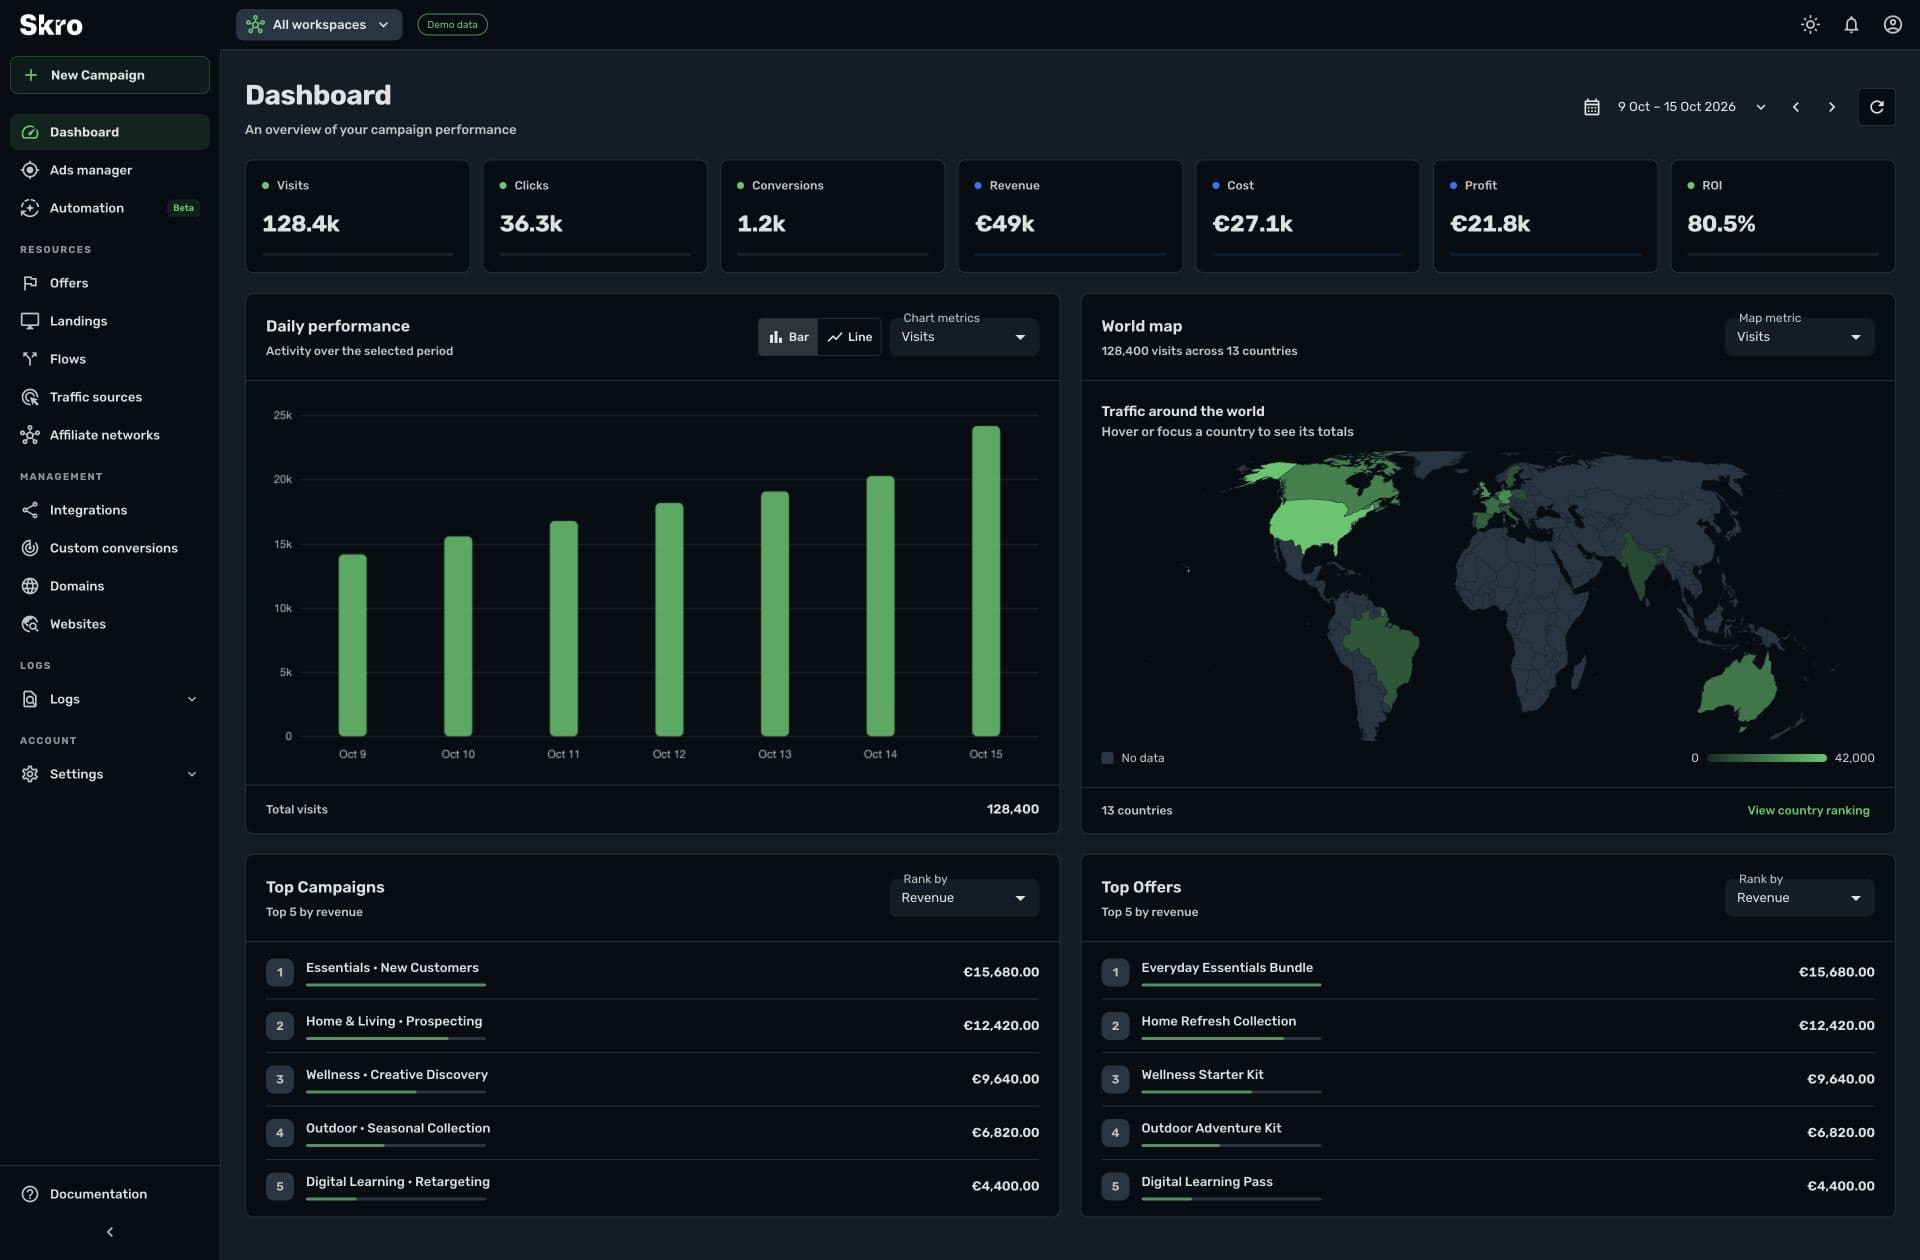
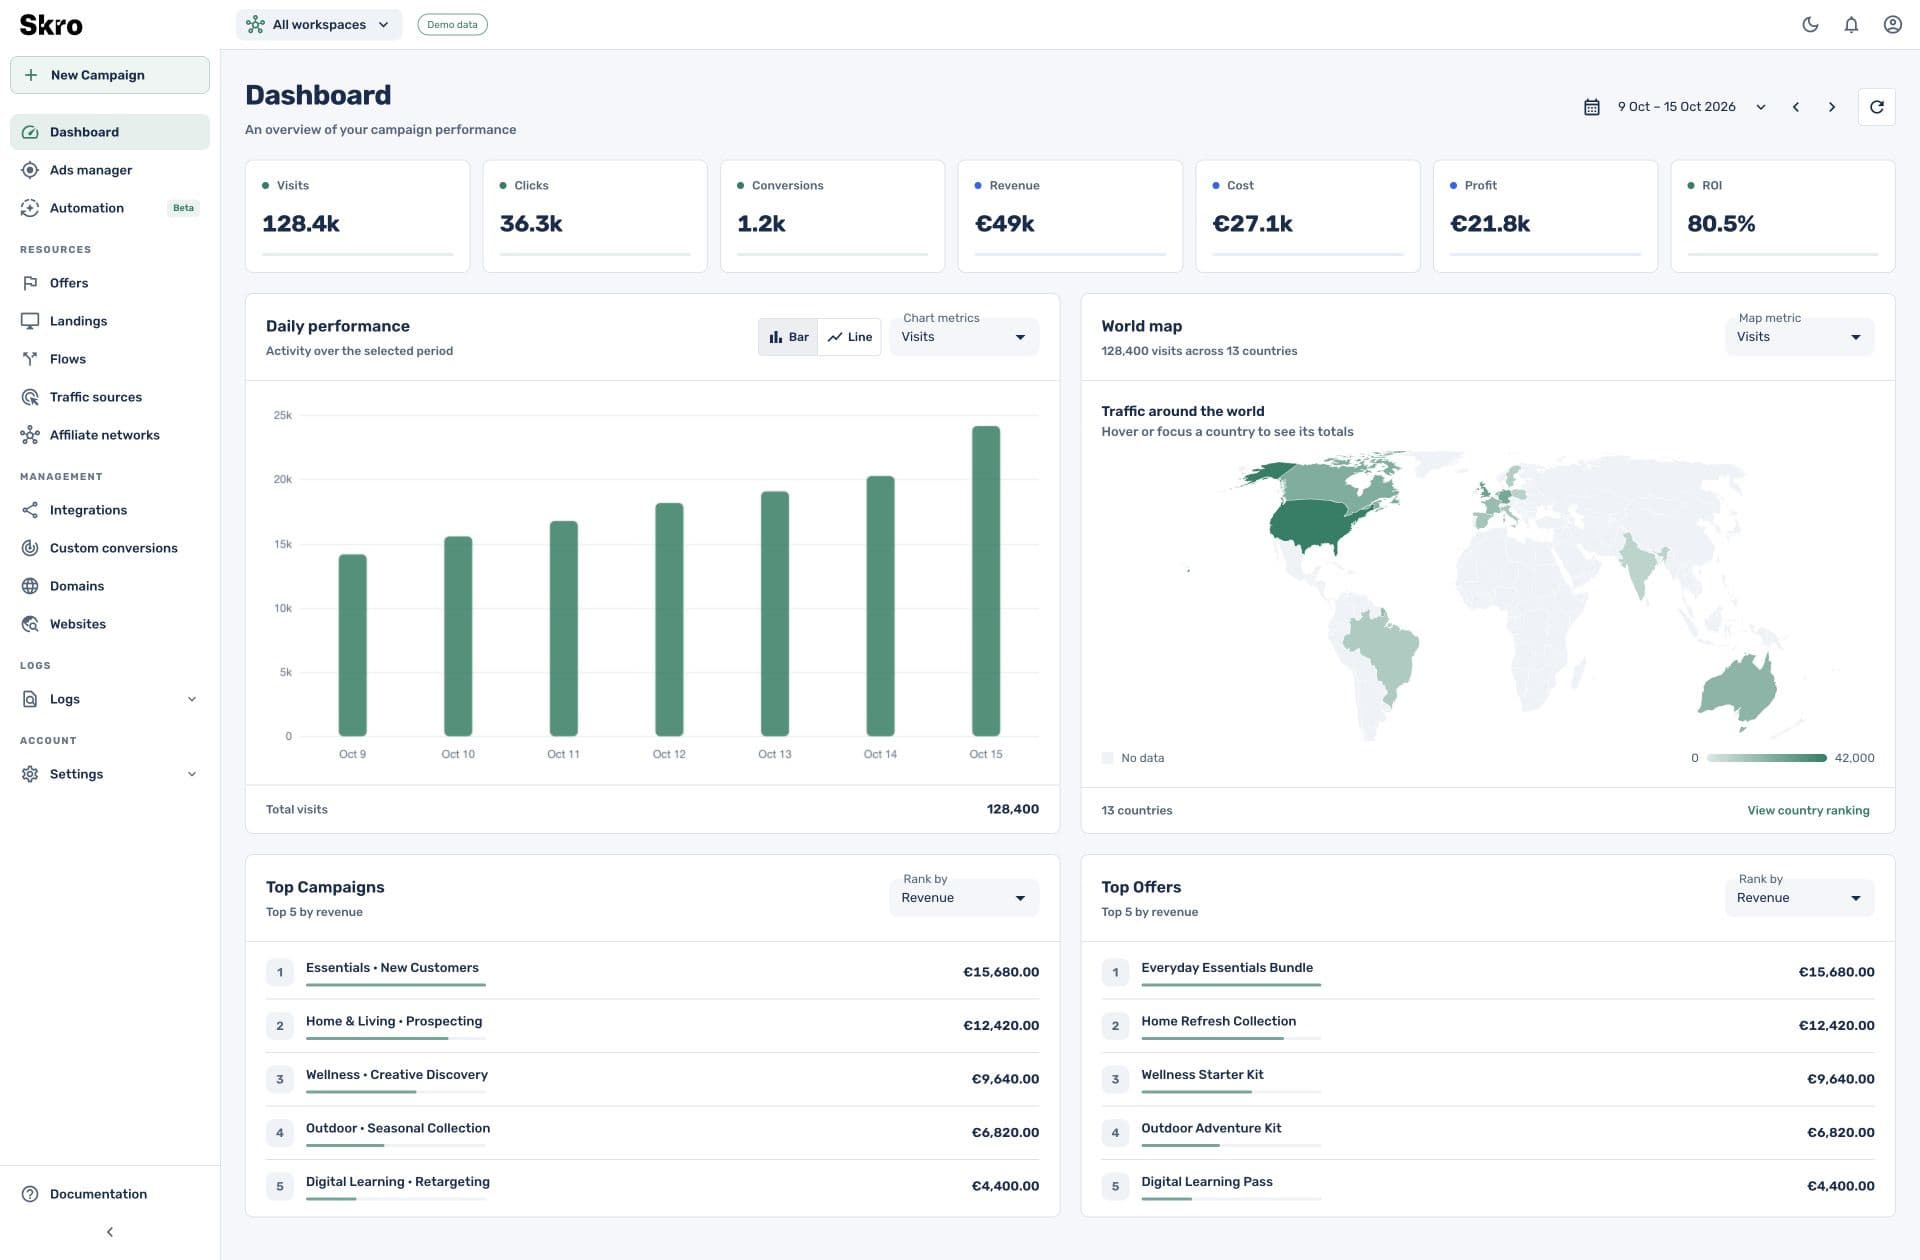
See key totals, daily performance, geographic traffic, and top campaigns and offers on the dashboard. Choose metrics that fit the question you are asking.
Explore the useful dimensions
Group reports by campaign, offer, landing, country, device, browser, time, source parameters, and supported postback fields. Use multiple levels to narrow the view.
Make the report your own
Choose and arrange columns, apply filters, use custom formulas where your plan supports them, and export the view or access reports through the API.
A dashboard that leads somewhere useful.
Compare revenue and profit over time, explore the traffic map, and review campaign and offer rankings. Move into detailed reports when a trend needs an explanation.
- Daily charts with selectable metrics and chart types
- Country totals and rankings alongside campaign performance
- Reporting history and custom columns according to your plan
Move from a broad question to a useful answer.
- 01
Set the context
Choose workspaces, dates, timezone, currency, and traffic-source filters.
- 02
Break the result down
Select grouping levels and columns to compare the campaigns or dimensions you need.
- 03
Share or act
Export a CSV, use reporting API access, or move to supported campaign controls with the same performance context.
Built to be set up.
Guides to get you there.
Follow the workflow for your platform, then test the full path before relying on campaign results.
Which metrics can I report on?
Skro includes visits, clicks, conversion counts, revenue, cost, profit, ROI, ROAS, and other performance metrics. Custom conversion events add their own event counts and revenue.
Can I see data by country or device?
Yes. The reporting API and UI support geographic, device, browser, source, campaign, and custom-parameter dimensions. Available metrics vary for some grouping types.
Can I export reports?
Yes. Skro supports CSV exports and reporting API access. Set the same date range, filters, and currency when comparing exported results.
How much reporting history is included?
History varies by plan, from 3 months on Free to 24 months on Enterprise. The pricing page lists the event allowance and history for each plan.
Make your reporting useful to the next decision.
Bring the campaign overview and the supporting detail into one workspace.